Recently I read a couple of questions regarding the display of reports with a large number of columns. Basically it is not considered good practice to flood your page with loads of information, same goes for a report: the more columns your report has, the harder it becomes to interpret. That being said, many applications are data intensive and breaking up all information in manageable portions can be challenging.
When it comes to a report, there are a number ways to streamline the data output. One such way is by displaying a number of columns in an inline view, I discussed that option in a previous blog post. Another way to limit the number of columns in your report considers grouping of columns and conditionally show and hide them. In this post I will explain how this works by example of the EMP and DEPT table.
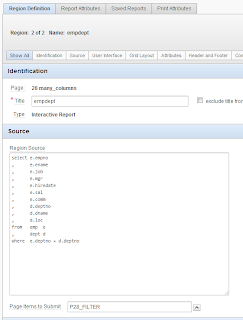
To start off we’ll create a report on both the EMP and the DEPT table. I’ve used an interactive report, but you can use a classic report if you like. A tabular form might work as well, but make sure that you don’t hide columns that are not nullable. The query is straight forward:
We want to group our report columns in a group EMP, a group DEPT, and to show the relation between the tables, we also want to show ALL columns. Now we need something to select one of these groups. We could use a page button that sets a page item, but we don’t really want to submit our page every time we want to change the report display, besides buttons are more associated with submitting data, a select list might do the trick, but a set of tabs looks better. So let’s create a bit of html that generates a set of tabs:
Note that I’ve used apex-rds* classes throughout the filter list. These classes are derived from the apex “region display selector”; this has the big advantage that we can adopt the css that goes with the region display selector, so our filter buttons will blend in nicely in our page. The html is stored in a separate html region. Make the html region a parent of the report region to ensure the filter tabs are visually associated with the report.

We hand each html list item an ID, these will be stored in a hidden page item that will be set by a jQuery function. The jQuery goes in the page attributes under JavaScript functions and global variable declaration and should look something like this:
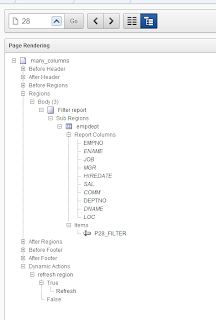
The “selected”-class is a visual aid that will distinguish the selected filter from the others. On page load we all select the first filter. The ID of the selected filter is stored in a page item (‘P28_FILTER’).
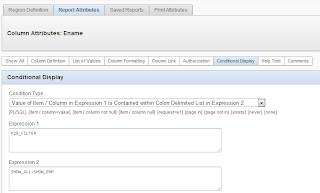
We’ll use the page item value as display condition for the report columns, we want all columns to show when we select “SHOW_ALL”, only the EMP columns when we select “SHOW_EMP” and only the DEPT columns when we select “SHOW_DEPT”. We can use a display condition “Value Item / Column in Expression 1 is Contained within Colon Delimited List in Expression 2”

Set these conditions on all EMP columns, and do the same for the DEPT columns only replace the ‘SHOW_EMP’ with ‘SHOW_DEPT’. In my example I chose to always display the empno and deptno columns, so I didn't hand them a display condition.
With the display conditions set, our page is almost ready, all we need is to refresh the report after we click a filter so the filter takes effect. For this we create a dynamic action that fires on click of jQuery selector ‘.apex-rds-li’, which is a class that all filter tabs have been handed. The dynamic action will do a refresh of the report region. Last, make sure that we add the page item in the ‘Page Items to submit’ section of the report

Now we have all in place and we should have a working report with filter buttons that conditionally display groups of columns. You can view a working example in my demo application.
Enjoy!
This comment has been removed by a blog administrator.
ReplyDelete