Thursday, 19 June 2014

APEX 5.0 Early Adopter 2

Recently Oracle released a new early adopter version of Apex 5.0. All workspaces from the early adopter 1 have been purged, so those who are interested need to request a new workspace.

In the ea 1 release we all ready saw some major new changes. The latest release contains some minor upgrades, most notably:

  • New Packaged Application capabilities introduced in Application Express 5.0
  • New theme features introduced in Application Express 5.0. The most important aspect being the 'Universal Theme'
  • New Websheet capabilities introduced in Application Express 5.0
You can check a list of all features -and known issues- here.

With ea2 released it looks like we're heading to an official release of Apex 5.0. That release is planned later this year, possibly late summer/early fall.
Until that time, have fun exploring the early adopter version.

Wednesday, 16 April 2014

Exchange Table Data with Drag and Drop, part 2

A few months ago I wrote a blog on exchanging table data with drag and drop. This worked ok, but a few weeks ago +Till Albert pointed out a nasty bug: when you drag all employees from one table to the other, you’ll end up with an empty table. Apex will not display the table or table header, but instead displays a “No data found”-message. As a result you can no longer drag data into the empty table.

As a solution I came up with the following modifications:

  • Extend the query of each table with an empty row
  • Make all rows except the empty row draggable
  • For display enhancement hide the empty row

To start with the new table query we can add an empty row with a union:

This will always give us one empty row as a result and therefore we will always be able to display our table. Because we want to add classes to all rows except for the empty ones, it is helpful to order the table data. This enables us to easily pick out the empty row. So let’s rewrite the previous query to:

Now we always end up with our empty row on top. With this in mind we can slightly change the way we add classes to the non-empty rows:

As you can see we simply skip the first row and add the class “emp” and “ui-widget-content” to all other rows. The last thing we need to do is hide the empty table rows, we can simply do that using the “hide” operator:

With these slight modifications your tables will always be visible so you can always drag rows into it. You can check the modified working example here.

Friday, 11 April 2014

Apex 4.2.5 patch release

On April 9th Oracle released a minor patch for Apex: release 4.2.5.

The new release includes "numerous bug fixes together with significant improvements and modernizations to the included Packaged Applications". Nothing shocking, but enough to keep us going untill the release of Apex 5.0, which is anticipated end of this summer.

You can download the latest release of Apex here.

Tuesday, 11 March 2014

Data load for multiple tables

The data load wizard was first introduced in Apex 4.1. It lets you upload data, from let’s say a csv file, into your database. The data load capability comes with a restriction: you can upload your data only to one table.

So what if your uploaded file contains data that should be stored in more than one table? Consider the following data:

This csv file contains both data from EMP table (EMPNO, ENAME), as well as from the DEPT table (DNAME). Out of the box you will not be able to upload the csv content to the database, because you can only upload to one table a time.

As a solution you can create a view on the EMP and DEPT tables and use that view to upload your data:

Of course you can’t insert, update or delete from a view directly, but you can create instead of triggers on a view to handle such DML tasks. The instead of triggers will help us to map the content from the csv file to the appropriate tables.

Now, when we would try to upload our csv file, with the instead of trigger the EMPNO and ENAME column will be mapped to the EMP table and the DNAME column will be mapped to the DEPT table. The DEPTNO column will be inserted or updated in both the EMP and the DEPT table.

For more info on instead of triggers, read the oracle documentation
For a guide on data loading in Apex, check the builders guide

Saturday, 8 February 2014

Interactive Report based on Dynamic SQL

Apex doesn't let you create an interactive report based on dynamic SQL. That is, not out-of-the-box. Apex does allow you to create an interactive report based on a function, so you could create a pipelined function based on dynamic sql, but with a pipelined function your report is predefined by the return type of your function. In this post I will demonstrate a way to create an interactive report based on dynamic SQL using Apex collections. The result is far more flexible than a report on a pipelined function. The setup will comprise of a few steps:

  1. create a function that returns a query as string
  2. create a before header process that creates a collection based on the query string
  3. create an interactive report based on the collection
  4. create page items to map collumn headers and a process to set the column headers
  5. Create display conditions for the report columns

What the function that returns the query looks like, is entirely up to your requirements. The function can be used in the before header process to create a collection. That process will look like this:

Next you need to create the interactive report. This is very simple since all data for the report is in the collection you create with the before header process.

This will create the interactive report, but this will render the column labels as C001, C002, etc. One way to create meaningful column headers is to create (hidden) page items for each column of your interactive report. You can create a process to fill the page items with the column names from your query and you can reference the column headers in your interactive report column names using the &Pxx_ITEM_NAME. notation. The procedure for within the process can look something like:

The procedure sets the session state for the page items. Note that, if you want to use dynamic sql based interactive reports on more than one page in your application, you can best create the hidden page items on your applications global page. Since you set the session state for the items, you can reference their value throughout your application. The cursor's select statement queries the column names from the “USER_TAB_COLUMNS” table. This works for all tables and user created views in your schema. However, if the result of your dynamic SQL is a complex query with joins over multiple tables, or when you don't include all columns of a table, you'll have to modify the query accordingly.

One last step we need to perform is to add display conditions to the report columns: we only want to show the columns in the interactive report, if they are needed, i.e. contain any data. You can use a simple display condition of type "Exists", in which you can use the following query:

Here you'll need to replace "XX" with the number of the column: "C001", "C002", "C003", etc. By now everthing is in place and your interactive report should be working. You can check an example in my demo application.
Good luck!

Monday, 3 February 2014

Apex 5.0 Early Adopter

This weekend Oracle launched the long awaited Apex 5.0 Early Adopter release. I just signed up for a workspace on apexea.oracle.com to check out some of the new features. I must say that my first impression is very positive. If you haven't already, you can sign up here for a free workspace

The first thing that struck me was that the look and feel of the application builder has changed slightly: they've used a flat design. As a test I've exported my demo application from apex.oracle.com, and imported it in apex 5.0. In general, this worked smooth and my application worked straight away. A few things were left for adjustment: the css and JavaScript files and the images that were stored in the database were not copied along. So I started uploading of my JavaScript file. That's when I noticed the first new features: instead of uploading files to an image, css or static files folder, you can create your own folder structure. Also you can bulk upload zipped files and -something I really missed in previous Apex versions- you can download files.

Since I made my own folder structure I also needed to change some of the file references. I navigated to the first page I wanted to edit and that's when I noticed the complete new layout of the page editor. The bulk of the editor is now made up of a grid layout, which displays your page and all its regions. You can drag and drop buttons and new regions into the grid and have your page setup in no time. Once you click on a page component, all the properties of that component are displayed on the right side of the screen. You can edit them straight away. Code fields have a modal pop up box with syntax highlighting, which is a major step forward from the small text area's that I was used to.
Unfortunately the modal editor doesn't seem to be available for dynamic action code fields.

After restoring my demo application, I decided to create a new app to check some of the announced features. First thing I wanted to check was if I could get more than one interactive report on a page. You can easily create more than one IR on a page, but only one can be active at a time. I'm not sure if there is an out of the box method to switch between active IR's, or that developers will have to create their own solutions.
Another feature I found was the pivot option of Interactive Reports, which lets you create pivot tables in just a few button clicks.

All in all my first steps in Apex 5.0 are very positive. It is really a big step forward from Apex 4.2. So I guess I'll be spending the next few weeks doodling in the new Apex environment and learn all of the new features. I'll update this post with new findings occasionally, so make sure to check back regular.

UPDATE:
I've taken a look at the new theme (Theme 31) and the templates. They look really nice. Again here the template editor has syntax highlighting, which aids readability. Even better: the editors come with code completion! Next to that the edit screen is enhanced and now includes separate fields for notifications and for sub templates. Also you have separate sections for JavaScript and CSS, for which you can include your own file paths rather than the Apex files.

Tuesday, 21 January 2014

Parameter input screen for Jasper Reports part 2

In my previous post I explained how you can create a parameter input form from which you can run a Jasper Report. In this post I will demonstrate how you can turn that parameter form into a modal dialog that pops up as you call it and closes once you run the report.

If you’ve followed the example in my previous post you’ll have one separate page with a dynamic pl/sql region as parameter form. To let it appear as a proper dialog, we need to us a plain template, something like “Popup” will do. For the region we’ll choose the “DIV region with ID”-template. With these templates we don’t get any of the region borders, page headers or tabs that come with other visual rich templates. For our dialog such a plain template is just what we need.

Now that the parameter form is ready, we need to go back to the page that will be calling the dialog. We’ll be calling the parameter form as an iframe. We need a HTML element to which we can append the iframe. We can create such an element in the “Page HTML Body Attribute” of the page. Here we’ll create a div to which we can bind the iframe:

Since we need to add this element to all pages that will be calling the parameter form, you should consider if you want to repeat the above step every time, or that you want to add the element to your page template.

Our next step will be the actual creation of the iframe. For this we need a dynamic action. This dynamic action needs to run when you want to start running your report, so on click of a button seems a logical choice. Make sure you set the event scope of the dynamic action to “Dynamic” to ensure you can still run the dynamic action after, let’s say a partial page refresh. The action will be a JavaScript action. The function that we are going to create will need to create an iframe with the URL of the parameter form page. We also need to pass the proper report id to the page, as the PL/SQL region will use this to evaluate what parameters need to be printed. Below function does exactly that.

By now we have a page that can append an iframe with the parameter form in it. To let it show as a modal dialog we need to add a few lines of code to the JavaScript function:

The last thing we need to do is to let the dialog close once we have run our report. This is a tricky part since we need to make sure the “close dialog” command runs after the report is opened. One way to do that is by creating a “closeIframe” function on the calling, or parent page and let the dialog call that function after the report is run. We can place the following function in our calling page under Edit Page > JavaScript > Function and Global Variable Declarations. Or again consider adding the function to your page template.

The closeIFrame function will be triggered by the parameter form page, so we need to go to that page and add some code to the dynamic action there. Place the following line of code after the window.open(url) :

That concludes the creation of the dialog popup. Following this two fold blog post you should have a full set up that lets you call a report parameter dialog from any given page. The parameters in the dialog will depend on the report id that you pass. For this you need to register your reports and their parameters, you can add them in a simple two table data model on which you can create a master-detail form. If you want to use lov’s you need to add the lov to the shared component lists of values.

Good luck!

Friday, 10 January 2014

Parameter input screen for Jasper Reports

Jasper Reports is often used as print engine in APEX applications. In this series of two blog posts I will discuss a setup to pass parameters to your Jasper report. The setup will consist of:

  • a page from which the report is called,
  • a parameter dialog,
  • an url to the report

This current post will demonstrate how to create the parameter screen and how to call the report. The second post will explain how to turn the parameter page into a dialog that you can call from another page.

For the setup I assume you have Jasper Server installed. The same method works for JasperReports Engine as well, however the syntax of the URL is slightly different. To display the parameter dialog you’ll need jQuery and jQuery-UI, if you do not already have that (recent APEX version have both by default), you should download/install them and include the in your page template.

To create a parameter screen, Apex will have to know what report and what parameters the report expects. For this we’ll need to create a few tables and an apex page. In the tables we’ll store some information on the report file and the parameters each report takes, you can elaborate as much on this as you want, for example extend the model with roles authorization to handle the display of certain reports to specific user groups, etc. For here we’ll stick to a basic model follows:

Note that with this model we’ll also track what input type a parameter should be (date/lov/text) and -when applicable- what lov should be used for that parameter. The Apex screen to register the reports will be something in the line of a master-detail form to administrate what reports you want to provide in your application and what parameters each report has. The effort of registering all your reports in your application has an added benefit: you’ll be able to make an overview page listing all your reports. This is a nice feature for your end users.

Now that we can track what parameters a certain report has, we can look into building the parameter screen. This will be a pop up screen that displays the parameters for a certain report. For this, you’ll create a new page and in that page add a region of type ‘PL/SQL Dynamic Content’. For the region source we need a procedure that will generate the necessary parameters. When we know what report we want to run we can simply select the parameters that go with that report. For this we will create a cursor that selects the parameters from the parameter table. We can loop over that cursor, check what type of input field the parameter should be (date/lov/text) and create an input item accordingly. For example:

In this code you might notice two things:

  • After the cursor for loop there is one last item added. This is a lov to select the export format of the report (‘docx/xlsx/pdf/..’).
  • The cursor takes uses a parameter ‘pxx_report_id’ –where ‘xx’ should be replaced by the page number of your parameter screen. We’ll create the page item in a moment.
  • - There is a hidden item generated for the report name. This will be used in a bit when we create url to run the report.
I choose to offer end users a number of output formats and let them select one. For this you need to make a lov in Apex, under Shared Components > List of Values. This also demonstrates how you should define any other parameter as lov input item: first define a lov in Apex and then use it as input parameter in ‘apex_item.select_list_from_lov’. If you have defined your parameter as lov then you need to register the lov name in the parameters table. The lov name will then be passed from the cursor to the apex_item function in the cursor for loop.

The page item ‘pxx_report_id’ is a hidden page item that is filled by the calling page when it calls the parameter input page. We’ll create the input item and also create a button ‘Get Report’, which will run the report. The button will be of type ‘Defined by Dynamic Action’.

Our dynamic action will be a JavaScript action that runs on click of the ‘Get Report’ button. Basically the function parses all parameter data after a base URL. The base URL should point to your report server. The tricky bid is of course that the number of parameters that we need to parse depends on the report that you want to run, so we’ll need a function that loops as many times as there are input items available. Our input items all have an index number (that’s what the v_inx variable in the pl/sql code is for). So we’ll just look for any input item with an index and for as many items as we find we’ll loop. In the loop we’ll look at the current input item and take the parameter name, which is stored as id, as well as the parameter value. We paste those two at the end of the URL. Once we’ve constructed the URL we can call the report with window.open(url).

By now we have a parameter page that will render parameters for any given report. It also has a button to run the report. The reports and their parameters can be registered using a master-detail page, and we can create a page of available reports. In the following post I’ll explain how you can turn the parameter page into a modal dialog and how we can actually call that dialog from another page in your application.

For now, enjoy!

Wednesday, 18 December 2013

Accordion navigation lists

Apex offers you various ways to navigate through an application. Tabs are commonly used, but navigation lists can also be used. I actually prefer navigation lists over tabs. With modern monitors and screen resolutions the page height is rather limited, whereas there is plenty of width. A navigation list makes better use of the abundant width and allows for more height of your active page space (for example a report- or form region).

A while ago I wrote a blog explaining how you can create dynamic navigation lists based on the apex_application_pages view. This works fine for smaller applications, but as your application grows, it’s harder to find the page that you want to go to, in the list. In this post I want to describe a solution to create navigation lists that can dynamically grow as you create new pages, but also can be ordered as to maintain lucid. I’ll also explain how to let each section of the list expand or collapse, to highlight the currently visited page.

First let’s think of what we want to accomplish. We want to end up with a list that can hold a number of pages, which can be subdivided in logical sections. We already know that we can add pages to the list by basing the list on the apex_application_pages view, where we select all the pages that have a page alias. The page alias will be used as name for the navigation list and we can include pages by setting their page alias. Apex allows you to subdivide the pages of your application in page groups. This feature can be useful for a number of things, but here we’ll will use them to create the sections for our navigation list.

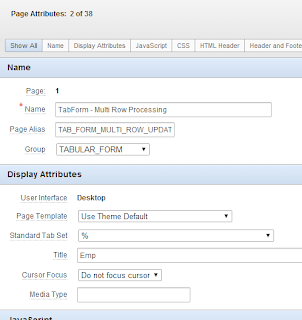
You can create page groups under Utilities>Cross Page Utilities (in the right hand menu)>Page Groups. Once you’ve creates the page groups (or soon-to-be navigation list sections) that you need, you can add a page to a page group by navigating to that page, go to page attributes and select the page group under the “Name” section. You can do this for each page that you want to include. When you’re done, each page that should be displayed in the navigation list should have a proper page alias and a proper page group assigned.
The list we are going to create will actually consist of a number of separate lists, each list representing a section of the total navigation list. So to create the navigation list, we must create a number of smaller lists. Each list will be a query on apex_application_pages view, looking for pages, within a specific page group, that have a page alias. Such a query should look like:
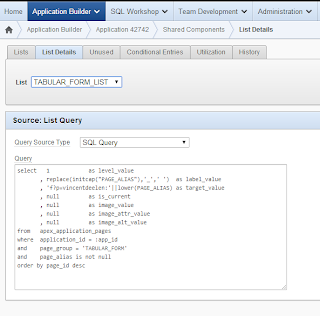
navigation list screen shot

Note that this query will include all pages from the current application, that belong to page group 'TABULAR_FORM' and have a page alias. The page alias will be the name that appears in the navigation list.

Once you have created a list for each page group/list section, we are ready to include the list in our application. We add the lists to the global page of our application (page zero in older versions of Apex). Create a new region of type “List” for each list section. Since we create these regions on the global page, they will appear in every page of the application. That might be a bit too much, so you might want to add a display condition that will ensure that the lists will only be displayed on the pages that are actually in the navigation list, i.e. the pages that have a page alias. All except for the login page of course. You can create a list region on page zero for each list section.
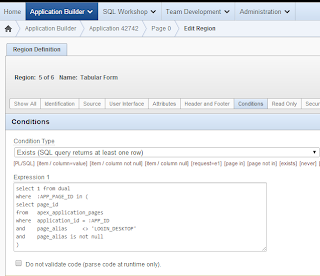
display condition for navigation list

We’re halfway there. We now have a list that is subdivided into sections of pages that are somehow related. The problem is that this list can grow long and will consume a lot of space. We can create an expand- and collapse effect to each section, this will result in a compact list and will also make the whole of navigation lists look more coherent. We can create the desired effect rather easily using the jQueryUI Accordion widget. Apex relies more and more on jQuery and jQueryUI, so it makes sense to use such a widget. Unfortunately we’re a bit ahead of our time with the accordion effect, so first thing we need to do is upgrade our jQuery libraries to the latest version. You can get these libraries on the jQuery site, or on the developers section of Google. Make sure you get the minified libraries of both jQuery and jQueryUI and add them to you application. –For this you can add the links to the libraries to your page template.
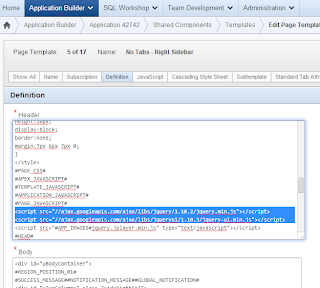
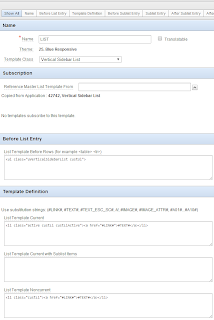
The next thing we need to do is to create templates for both lists and list regions. This is due to the way the accordion widget works. The widget always looks for a header type section and treats the consecutive div element as an accordion. The default Apex templates are all use a number of layers of elements. As a result the accordion widget will not work properly. Creating templates is not very difficult, and fortunately in this case we need very basic templates.

The list template needs to look something like:
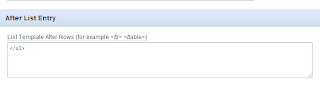
And don't forget to close the list element:
In the same style we need to create a list region template, which needs to look something like:
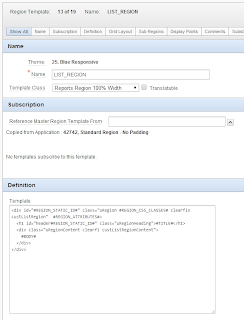
We can now change the list templates and the list region templates for all the lists on our page zero, we choose our newly created custom templates. With that set, all that's left to do is create a dynamic action that will implement the accordion widget for our list sections.
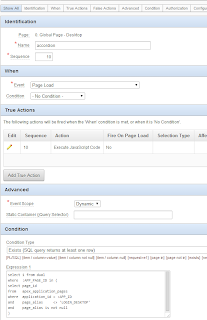
Like the list regions, make sure that you add a proper condition to the dynamic action to make sure it will only work on those pages that have a navigation list.

To the dynamic action we will add a javascript action that will implement the accordion widget.
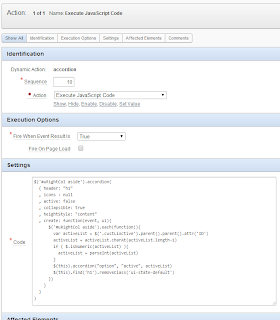
Here the create function will ensure that the list that contains the currently visited page will be opened on page load. The draggable line is optional and makes the region draggable across the screen.

This concludes the last step. We now have a navigation list that can contain a large number of pages. Pages will be grouped in sections based on page groups. We can add new pages to the navigation list be giving those page a page_alias and by assigning them to a page group. On top we can expand and collapse list sections, which results in a compact and lucid look and feel.

Following is a list of references for more in depth information on:

The navigation list as discussed is implemented in my demo application, visit it here for a working example.

Good luck!

Sunday, 1 December 2013

Overflow region in Tabular Form

A while ago I wrote a blog describing how you can add a detail section to a table row. The idea consists of a standard or interactive report on one page and a detail report or form on another page. An iframe is used to display the detail section in line with the master report.

This works for standard or interactive reports. For a tabular form on the other hand, this is not quite suitable, as the data from the master and the overflow details will be submitted separately. In this post I present an alternative solution to add an overflow with details in a tabular form. The general setup consists of a view that selects all the columns we need to include, both for the master tabular form as well as the overflow details. For the insert/update/delete operations we need to create instead of triggers on our view. Next we need a dynamic action that will place all the details columns in an overflow row, and last we need a dynamic action to show and hide the overflow rows.

As an example we’ll create a tabular form on the good old EMP table and place the accompanying DEPT data in an overflow row. For this we first need to create a view on EMP and DEPT:

We now have a view on both the EMP and the DEPT table. To allow for DML on the view we need to create instead of triggers. We’ll create three separate triggers: one for inserts, one for updates, and one for deletes.

At this point we are able to create a tabular form on EMP_DEPT_V which will show all columns of the view and will allow to add-, change-, and remove rows. Our next step will be placing the DEPT columns in a separate row under the EMP columns. For this we need a piece of JavaScript that will look for the DEPT columns in each table row, pick them up and put them in a separate row, and place that row after the original table row:

We want the JavaScript to run as soon as the page loads, so we create a page load dynamic action of type JavaScript and place the above code in that dynamic action. The last thing we need to do is create a dynamic action that will show and hide the overflow details. We’d want the details to show when the checkbox of that row is checked, and hide the details when the checkbox is not checked. We can create a dynamic action that responds on a click on a table row and checks if the checkbox of that row is actually checked:

Dynamic action to create overflow for tabular form

In this dynamic action we can add a true action that will show the overflow row when the checkbox is checked:

In the same style we can create a false action that will hide the overflow row when the checkbox is not checked:

Since we want the overflow to be hidden initially, we need to check the “Fire on page load” attribute in the false action (but not in the true action!):

Dynamic action false action

With this last step our page is ready and should be working. As always, you can watch an example in my demo application . When implementing this setup, keep a few things in mind: this setup is limited to one detail row per master row, or analogue to our example, we can show the department details for an employee, but we can’t show all employee details for each department. Also the JavaScript used to build the overflow row is not easy to reuse, all columns are handled separately. This is to better show what the JavaScript is actually doing. A better solution would be to pass all desired columns as an array to a function that builds a row based on the column names specified in the array. The great benefit on the other hand is that this rather simple set up will only relocate the detail columns and leave everthing else in place. you can, for example, still reference the overflow columns using the their fxx_ array.

For more information on instead of triggers you can consult the Oracle documentation.

Enjoy!

Sunday, 17 November 2013

Pimp my Site

The last few days I've received numerous questions all in the line of "How do I format page/region/report x, giving condition y?" I decided to write a blog to outline a number of ways you can add style to your application.

Let’s start by saying that an APEX application is, in general just HTML generated by a database, so your application can basically be treated as any other website. This means you can use the same methods of styling and editing a page in APEX as you can with a conventional website. Style of a website is handled using a stylesheet, CSS. You can add style properties in your stylesheet and assign those properties to HTML elements using there element id, class, type, etc. Or at least, that is good practice. You can also add style in line in your HTML using <style> tags.

Back to APEX. APEX allows you to add style to page your application, your page or page items in a number of ways.

Quick 'n' Dirty

Probably the simplest way to add style to an element is to use the jQuery CSS operator. For example:

You can add this script in your page HTML header.

Although this will work perfectly ok, adding style attributes like this can cause you a lot of headache once you need to do site maintenance. Besides, you’d have to add this style script in every page and for every item for which you want to modify the style.

Use a stylesheet

First of, adding style directly to an element is generally considered bad practice. You’ll easily lose track of why your application appears the way it does. So let’s start by making a CSS file. This file will contain all the style modifications we want to make. One big advantage of a stylesheet is that we can reuse it throughout our application. So, say that we want all input fields of a page to display in bold, we can create the following stylesheet:

We can upload this stylesheet to our application file directory and include the file path in the CSS file URL’s of the page attributes.

Use a bit off class

Not very often will we want to modify all the input fields of a page. More likely you’d want to change only a few items. If you still want them to always hand them the same set of style attributes, you can use classes. The use of CSS classes allows for a finer grained style modification.

These classes can be added to field items in page item attributes, in the “HTML Form Element CSS Classes” attribute, under the section “Element”. For reports you can add the classes to a column under “Element CSS Classes” which you’ll find in the column attributes of your report. You can refer to your class in the stylesheet, our stylesheet would look something like this:

Where input items or report columns with class “inputBold” would show text in bold, and fields with class “inputItal” would show text in italics.

>

Template modification

Now that we know how to include stylesheets in a single page we can also try to include our stylesheet in all our pages. For this we can include the path to the file in every single page, but that can be quite a bit of work. You’d be better off to create a HTML region in your application’s global page (page 0 in older versions of APEX). You can include the file as follows:

In this example the stylesheet should be uploaded to your applications image directory. Including your file in the application global page will ensure that the file is loaded for each individual page.

An even nicer solution is to include the css file in the header definition of your page templates. You should add the link to your stylesheet somewhere between the <head></head> tags. Be aware though, modifying your application’s template affects all the pages in your application and when done wrong, might ruin your entire application.

CSS in your query

Now that we know how to add stylesheets to our application and we can add classes to fields or columns, we can look at a special case: what if you want to apply one style under certain circumstances, and another style in other circumstances? Let’s for example take a balance table with some income posts and some expense posts: How can we show the expenses in red and the incomes in green?

For this we can expand our report query with a column in which we select a style class, or a colour based on a case statement: We can refer apply the column_style colouring to our amount column by using the column attribute “HTML Expression”, which you can find under the section “Column Formatting” of the column attributes. Here we can add a HMTL expression in which we refer to our columns using the column header substitutions (the column name between #):

Although there are more ways to modify style in your application, this post describes some the most common ones.

  • For additional information on stylesheets in APEX you can also consult the Oracle documentation.
  • My explanation of conditional formatting and the use of HTML expressions is based on the blog of Tyler Muth.
  • For more detailed explanation of stylesheets in general and for CSS syntax, please check w3schools.

Lots of fun styling your application

Friday, 1 November 2013

Exchange Table Data with Drag and Drop

This post will describe how you can use jQuery drag and drop to move records between two tables. In my example, as always I’ve used the EMPLOYEE and DEPARTMENT tables. The drag and drop effect will help to transfer employees from one department to the other.

The setup is fairly simple: first of it requires two tables on employees per department, here I’ve used the employees from department number 10 and 20. For the sake of simplicity, I’ll use a simple query that doesn’t include all employee details:

To make each report row draggable, we need to be able to simply identify each row, so we add a class to each report row for both tables:

We want these functions to add the classes on page load, so either put the code in a page load dynamic action(for older Apex releases), or put it under “Execute when page loads” in the JavaScript section of the page attributes.

Now that we have two reports, each with rows of employees, which have a few distinctive classes, we can almost add the drag and drop effect. Almost. When we can drag table rows around, we need some mechanism to track which employees have been moved, so that we can actually save our changes. For this we will use two hidden page items, one under each report. In these page items we will store all employees that we need to update. Also we need to create a page button to submit our page. We need this for the update process that we will create later on.

With everything in place we can add the drag and drop effect. The code looks as follows:

You can put this code in your page’s html header or in a separate JavaScript file if you like. Note that I’ve included the jQuery and jQueryUI libraries in the code. If your Apex version is up to date, you probably do not need to include these files, as they are distributed with your Apex install.

The first function of the previous code segment makes all employee records draggable; here we use the ‘emp’ class which we added in the previous paragraph. Each table row now can be dragged around so next we need to make the tables droppable. This In essence means that each table can receive a draggable table row. That each table row can be dropped in a table is defined by the ‘accept: “.emp”’ part in the droppable functions. What should happen when you drop a table row in a table is defined in the ‘drop: function(…’ part. Here each dragged row is added as last row to the table and next the empno of that row is added to a colon delimited string in the hidden page item.

At this point you should be able to drag rows from table to table. Also all the empno’s of employees that have been moved from table to table, have been stored in two separate hidden page items, one for deptno 10 and one for deptno 20. The last thing we need to do is to create an update procedure to save our changes to the database. Here I’ll use a page submit process, but you can also write an AJAX process if you prefer to handle the updates asynchronous. The process should look something like this:

The update process casts each string from the hidden page items to an array. Next we loop over each array and change the department number for the employee.

With this final step we have everything in place. We can identify table rows with a class. We use that class to make the rows draggable. We have two page items to store the empno’s of each table row. Also we have for each table a drop effect and which lets the tables receive new draggable rows and we have a drop function which places each moved row at the end of the table and stores the empno’s in the page items. Last, we have a process to update the tables and change the department numbers for each transferred employee.

To view a working demo, please visit my demo application. For more information on drag and drop view this old post of mine, or go to the jQueryUI site.

Have fun!

Monday, 14 October 2013

Dynamic navigation lists

In Apex, lists can be quite useful for navigation. In fact, when set up right you can have add a navigation list to your application that grows with each new page you add to your application, without the need to update your list. I worked this out in my demo application when I wanted to make it easier for people to browse through various pages.

In my demo app, there are a number of pages which I consider worth sharing, those pages I wanted in a navigation list. Then again, there are also always a number of pages that are under construction or just not that interesting. Those pages I didn't want to be included in the list. My solution was to use page aliases for the pages I wanted to include in my navigation list and create a dynamic list with a query on the apex pages view.

This goes as follows: first, under shared components, create a list. Make sure to choose a dynamic list, and as query use something like:

When prompted, you do not need to create the region yet. We will do this in the next step. For now just complete the creation of the list.

Next, on our global page (page zero), we create a new region and choose list as region type. Here you can also choose the region template. When prompted choose the list we created in the previous step and select an appropriate list type. As display condition we choose a condition such that the navigation list only appears in those pages that we want to be included in the list itself, here that are the pages containing a page alias. Choose [exists] as display condition and as expression use:

With this query, the list will only be displayed in the pages that have a page alias (except for the login page).

By now our list is completed. Now, if you add an alias to a page, the page will be added to the navigation list and the list will be included in that same page.

For more info on creating lists, you can check the Oracle docs.


Good luck!

Saturday, 28 September 2013

Embedding media in your APEX application

In this post I will explain various ways to incorporate audio- and or video files in your APEX application.

With HTML5, generating a media player is really easy. In fact, <audio> and <video> are elements that can be interpreted by most up to date browsers. All you need to do to create a HTML5 media player is upload a file to your file server or image directory and refer to it in a HTML region:

What’s also very interesting is, since <audio> is a native element, you can store your audio files as BLOB in the database. When you create a report on the table containing the BLOB files, you can set the download column to ‘inline’, and then you can start playing a file in your browser, straight from the database.

Blob Column Attributes

The downside is that your browser needs to support HTML5. If you’re not sure that your application is used only on HTML5 capable browsers, then you have to consider building your own media player. There are a number of media player plugins which are based on jQuery. One that stands out from the others is jPlayer.

JPlayer is actually a quite simple, yet very flexible plug in, written in jQuery. All you need to do is download the jPlayer library and make sure you have the jQueryUI library as well. Once you've loaded them to your file directory you can start building your own media player. For a very basic setup, you can simply create an html region and put the following code in the Region Source:

This will create the buttons for your media player. Well, maybe not the buttons, but we’ll make the list items appear as buttons later on with CSS. First let’s make our html region a player by adding some JavaScript. You can put the following code in your JavaScript file, or put it in your Region Source before the HTML. Make sure to put <script> tags around the code if you put it in your region definition:

Replace "#APP_IMAGES#Spinal Tap - The Sun Never Sweats.mp3" with your own song of choice that you’ve uploaded to your images directory. At this point your media player should be working, so now it’s time to make it look like a player as well. If you’ve not yet uploaded the CSS file from the jPlayer, now is the time. Upload it to CSS folder and make sure to place the accompanying images in the same folder as well. The images are used to show the play/pause and other buttons. If you prefer to keep your images in a separate image folder, you should edit the CSS file and edit the links to the images. If you’ve uploaded the CSS file last thing you need to do is include the file in your page by adding a link in your page html header:

Your audio player is set now. You can further customize anyway you like using CSS, jQueryUI and jPlayer functions and attributes. Now if you want to display a video in your application you can modify the audio player we’ve made, following the jPlayer guidelines. But take in consideration that video files can take up a lot of storage space (a particular problem if you use a workspace of limited size). Another way to include a video in your application is to embed it. You can upload your video to YouTube, Vimeo, or wherever you like. For here I’ll use a YouTube video.

To embed a YouTube video, choose your favourite video on YouTube and right click the player. From the menu choose the option “copy embed code”.

This code goes somewhere on your applications page, for example in the region source of an html region and you’re ready.

If you want to watch a working demo of the discussed media players, please visit my demo application.


Good luck!

Friday, 13 September 2013

SEPA direct debit initiation with Oracle XML DB

SEPA Direct Debit (SDD) is a payment instrument for the SEPA (Single Euro Payment Area) that is to replace current debit methods for most European countries. As of February first, 2014, SDD will be the standard debit method for all transaction within- and cross- SEPA countries.

The standardisation of payment methods comes with drastic changes for companies that work with automated transaction orders. The transition towards SDD can be a very challenging process, especially for smaller companies that lack the in company knowledge of IT and SDD. As a board member of a sports club, I too was faced with the challenge to implement the new SDD standards. Rather than buying a software package, my wish was to incorporate the SDD in the APEX application that we were already using for our clubs’ administration.

The result had to be an XML file that can be send to our bank. The simplest way to generate the XML file from within the APEX application would be by a single button click. With that in mind I considered a number of option, for all weighing the pro’s and con’s; the main trade-off being ease of maintenance versus runtime or resource use of the file production. In the end I settled for a function that is mostly query based using the XMLelement and XMLforest functions.

First things first, the migration to SEPA and SDD is a process that should be well planned and requires quite a bit of time, mostly spend on reading all the necessary documentation on SEPA and SDD. Fortunately the rules and requirements for SDD are well documented (follow link at the bottom of the post). Once you are well acquainted with all the documentation you can start writing the function that will generate you XML file. It pays off to think and plan the design of your function, in the end it is not too difficult, but there are some things to take in consideration. For example, you must ensure that your underlying data model holds all the required data, for example:

  • SDD requires IBAN rather than old fashioned account numbers
  • SDD requires BIC (Bank Identifier Code)
  • The XML file must have separate batches for new/first time debits and existing/recurring debits

When your data model is capable of storing and providing all the necessary data, you can think about the structure of your function. The resulting XML file basically consists of one or more payment info blocks, preceded by a group header. Each Payment section consists of a number of related transactions, the corresponding group header provides a subtotal of that payment section. These blocks and headers are wrapped in a “CustomerDirectDebitInitiation” block, which in turn is wrapped in document tags that hold general information such as xml version, character set, and XML namespace. Your function should, like the resulting XML file, consist of a few sub functions that each can:

  • Collect transaction specific information and write them to a payment block
  • Calculate subtotals over related transactions
  • Wrap payment blocks and their corresponding headers
  • Return a XML file

Each transaction holds information like debtor, amount, IBAN, account name, etc. This should all be data that you can retrieve from your database. Since we need XML, you can use a number of XML DB functions in your query. For the following queries I used the EMP table and extended it with an EMP_ACOUNTS table, which looks as follows:

The query to collect all transactions for a payment section can look something like this. This query should be preceded by a heading which summarizes all payment details of the transactions. Because the data in the heading depend on the data in the payment section, it makes sense to create a function that uses the payment section query to collect transaction info, and uses that info to construct a payment header. In my case I created separate function to create the header of each payment section, and a function that can create an xml block based on a collection of transactions and a payment header.

All payment sections for the file should be bundled and preceded by a group header which summarizes a total of all transactions in the xml file. Since at this point we have all our data, a function to create a group header is not much work. For example:

I chose to let this function being called by the same function that also creates the payment sections. The result of this function is a file that holds all the data for the SDD XML file. All we need to do now is make it a XML file. For this we need to add a few tags with info on the XML version and XML namespace. For this we can use the xmlroot function from Oracle. That function adds the XML version and namespace data and returns a XML file. An example of the function can be:

The result is a XML file that you can send to your bank as SDD. Of course there is room for variation. In my case a lot of the data is fixed, such as the collection amount and frequency, or the creditor name and details. Therefore I chose to put a lot of that data in variables, but you can easily parameterize these variables. Note that not the details you need to provide in your XML file can vary and depend on the way you do your transactions (i.e. you do them yourself, or let a third party collect). Another major factor is the requirements of your bank or country. So before starting to program it is advisable to consult your bank on the data you need to provide.

All in all, making your company "SEPA proof" is something that requires carefull planning and should be well thought before starting. The way you design your program or application depends on a number of factors, including your datamodel, collection method, and bank requirements. But with these factors in mind, it is well possible to create your SDD files.

Good luck!

For a working demo of the code,have a look at my demo app.
If you want the packaged code, please contact me.
For extensive documentation on SDD check the website of the European Payments Council
For documentation on Oracle XML check the Oracle XML DB Developer’s Guide

Thursday, 29 August 2013

Filter column groups in a report

Recently I read a couple of questions regarding the display of reports with a large number of columns. Basically it is not considered good practice to flood your page with loads of information, same goes for a report: the more columns your report has, the harder it becomes to interpret. That being said, many applications are data intensive and breaking up all information in manageable portions can be challenging.

When it comes to a report, there are a number ways to streamline the data output. One such way is by displaying a number of columns in an inline view, I discussed that option in a previous blog post. Another way to limit the number of columns in your report considers grouping of columns and conditionally show and hide them. In this post I will explain how this works by example of the EMP and DEPT table.

To start off we’ll create a report on both the EMP and the DEPT table. I’ve used an interactive report, but you can use a classic report if you like. A tabular form might work as well, but make sure that you don’t hide columns that are not nullable. The query is straight forward:

We want to group our report columns in a group EMP, a group DEPT, and to show the relation between the tables, we also want to show ALL columns. Now we need something to select one of these groups. We could use a page button that sets a page item, but we don’t really want to submit our page every time we want to change the report display, besides buttons are more associated with submitting data, a select list might do the trick, but a set of tabs looks better. So let’s create a bit of html that generates a set of tabs:

Note that I’ve used apex-rds* classes throughout the filter list. These classes are derived from the apex “region display selector”; this has the big advantage that we can adopt the css that goes with the region display selector, so our filter buttons will blend in nicely in our page. The html is stored in a separate html region. Make the html region a parent of the report region to ensure the filter tabs are visually associated with the report.

parentRegion

We hand each html list item an ID, these will be stored in a hidden page item that will be set by a jQuery function. The jQuery goes in the page attributes under JavaScript functions and global variable declaration and should look something like this:

The “selected”-class is a visual aid that will distinguish the selected filter from the others. On page load we all select the first filter. The ID of the selected filter is stored in a page item (‘P28_FILTER’).

We’ll use the page item value as display condition for the report columns, we want all columns to show when we select “SHOW_ALL”, only the EMP columns when we select “SHOW_EMP” and only the DEPT columns when we select “SHOW_DEPT”. We can use a display condition “Value Item / Column in Expression 1 is Contained within Colon Delimited List in Expression 2”

displayConditionExample

Set these conditions on all EMP columns, and do the same for the DEPT columns only replace the ‘SHOW_EMP’ with ‘SHOW_DEPT’. In my example I chose to always display the empno and deptno columns, so I didn't hand them a display condition.

With the display conditions set, our page is almost ready, all we need is to refresh the report after we click a filter so the filter takes effect. For this we create a dynamic action that fires on click of jQuery selector ‘.apex-rds-li’, which is a class that all filter tabs have been handed. The dynamic action will do a refresh of the report region. Last, make sure that we add the page item in the ‘Page Items to submit’ section of the report

pageItemsToSubmit

Now we have all in place and we should have a working report with filter buttons that conditionally display groups of columns. You can view a working example in my demo application.

Enjoy!

Saturday, 24 August 2013

Using radio buttons in an APEX report

In my previous post I used the apex_item package to create a report with html input fields and checkboxes. In this blog I want to show a way to implement radio buttons in your report.

Radio buttons are very useful when you want to hand your users a limited number of options and you want to ensure that only one option can be selected. From a user point of view, a radio button is very intuitive. To implement them in an APEX report however, is a little less intuitive. To explain the implementation we will create a report on the “EMP” table where we use radio buttons to assign employees to a department.

To get started we’ll create a report on the “EMP” table, but instead of the “DEPTNO” column we will select a set of radio buttons, one for each department number. The query looks as follows:

Note that we use rownum as index parameter. This ensures that all radio buttons on the same table row, have the same index, so only one radio button per table row can be selected. This provides a challenge later on, because we have to assess each row to determine what button is selected. This is a bit different than, for example the checkboxes in the first column of a tabular form, because they are assessed on column level, so you can refer to the f_array of that column to get each selected value.

Since we can’t use an f_array to determine department numbers, we will use jQuery to loop over the table rows and see which department is selected. To do that we need to hand each radio button an html class, this is handed in the “attributes” parameter.

In this query a display name is also handed, that can also be discarded since that name will also appear as column header, in practice you can use either one, which ever suits you best.

Also we hand our report a static id. Here it’s called “radioReport” and last we’ll create a hidden item for each department that’s in our query.

Now that the report is set up, we’ll create the jQuery function that loops over the report and check the radio buttons. In the end we want to update the "EMP" table, and assign department numbers to employees, so we’ll create a function that looks at each table row, sees what department is selected and store the employee number of that table row in the appropriate page item. For example:

This function will be handled by a dynamic action. The dynamic action must be triggered by a click on either radio button, so we use the radio button class that we added in the query as the trigger of the function.

dynamic action triggered by radio button jQuery function mapping employees to departments

Now that we have our report and we can check which employee belongs that each department, we have to write an update procedure. For simplicity we’ll use a page process that is triggered on submit of the page, for this we need a submit button and a page submit process. The update on the “EMP” table can be done in a number of ways; here we’ll use the “STRING_TO_TABLE” function to map each employee number of a page item into an associative array, the “APEX_APPLICATION_GLOBAL.VC_ARR2”. For the update we loop over each array and update the department for each employee.

And now we have a working report with radio buttons. You can check a working demo on my demo application. Of course don’t forget to check the Oracle docs for more info on apex_items, or string_to_table.

Good luck!

Sunday, 11 August 2013

Two tabular forms, one page

Tabular forms are very effective when it comes to mutating (table) data. Unfortunately APEX allows you to use only one tabular form per page. Lucky for us, there are ways to get more than one tab form on a page. In my demo application I have one example of two iFrames in one page; each iFrame contains a tabular form page. This is about the simplest way to get two tab forms on a page. Sadly this way you will have a set of buttons for each page. A more advanced way is to create the tabular forms yourself, instead of using the APEX generated tab form. There are a number of examples on how to do that, see amongst others Denes Kubicicek and Martin D'Souza.

In this post I would like to add to the stack, an example of how you can easily create tabular forms yourself. In the example I will use the apex_item package to create input fields for each report column. On top I'll use jQuery to add rows and in preparation of the delete process. The use jQuery for adding rows to the form shows a bit more of what apex is doing in the background when you generate an apex_item field. And, best of all, one tabular form is going to be an interactive report, with sorting and filtering options.

To start we create an interactive report on the EMP table, but instead of doing a normal "select * from EMP", we need to call each column with apex_item functions. The query will look as follows: apex_item_emp_query The number in the apex_item that precedes the column name, refers to the f_array the column will be mapped to. Make sure that each column is set to 'Standard Report Column' in the report attributes section. We also add a static ID to the report, this is needed later on when we create the add row function. Our report on EMP is now ready.

Next, we create the DEPT report. This is done the same way we created the EMP report, only now we choose a standard report (APEX allows you to create no more than one interactive report per page). Again, make sure each column is set as 'Standard Report Column' and provide a static ID to distinguish your report. The query will look like this: Note that we already used f_01 to f_09 for our EMP report, so we have to choose another range of numbers for the apex_items of our DEPT report. Here I used 11 to 14.

Now that we have two reports with input fields, we need to create a procedure to handle the inserts and updates on the EMP and DEPT tables. You could do this in one process, but here I made one insert/update process for EMP, and one for DEPT. That way it's easier to see what's going on. First we create a submit button. Then we create a page process that fires on submit, after computations and validations. In the process we need to loop over the f_array and map each f_item with the correct table column, so f_02 is EMPNO, f_03 is ENAME, etc. page_process_EMP_DML The process for DEPT table is basically the same, the code will be: Note that I've put list tags around the success message. We will use one submit button that triggers both processes, with list tags both success messages will show better. Make sure that you add a button condition to the processes so we only do an update or insert when the button 'submit' is pressed.

At this point we can do updates on both tab forms. The process for inserting records is there as well, so now is a good time to create our 'add row' function. The function will basically copy the last row of a table, empty all data and paste the row at the end of the table. Since this is a generic function that can be used on more than one page in your application, you should put the function in a JavaScript file that you include in your application. Here I simply put the function in the page header. page_header_js The function expects a table ID as input. We gave our reports static ID's, but unfortunately APEX tables are wrapped in a number of div's and tables, so we need to add an ID to the exact table as well. This is done by a page load dynamic action. da_act_ID The dynamic action adds an ID to the table within a table within the table that we gave our static ID. With ID's added to the correct tables we can now create the dynamic actions that call the addRow function. To call the function we need two 'add row' buttons, one for each report. For simplicity I've created a dynamic action for each add row button, this could of course be done with one function as well, but then you need to determine which button called the function and thus to which table a row needs to be added. The dynamic actions will fire on click of the add row button and it will call the addRow function with the appropriate table ID. da_add_row da_act_add_row By now we can add rows to each report, so we can update and insert records.

The last thing we need to do is make create a delete process. We want to delete all rows we've checked with the report checkboxes. The checkboxes of the EMP table and the DEPT table all hold the primary key values of each table row, so it makes sense to use that. We'll create a dynamic action that looks for checked checkboxes and store their corresponding values in a hidden page item. The dynamic action is fired when a checkbox of either table is clicked. da_PKda_act_pk 'P17_EMPNOS' and 'P17_DEPTNOS' here are our hidden items. We store our primary key values in these items as colon delimited strings. The delete process is plain simple, now that we have our primary key values. We use apex_util.string_to_table to create a vc_array of pk values and use that for a delete: delete_process Now we only need to create a delete button and make sure the delete process only fires when the delete button is pressed.

That was the last step in the way. We now have one page with tow tabular forms. One tabular form is an interactive report. Each report has its own 'add row' button, page the page submit buttons control both tables. As I wrote at the beginning a used jQuery to add a row to a table because it helps to show what APEX is doing when you create apex_items: it simply generates the html for an input field. The f_xx number is used as name attribute for each input field. Note that this ‘add row’ function works well, but since it copies the html of the previous row, it only works if your report has at least one row to begin with. If you create a report on an empty table, there would be no table row to copy the html from. For the interactive report it serves to tell that all input fields are rendered as strings, even the numeric fields. Therefore aggregations on columns -e.g. the sum of salaries per department- won't work. Despite these issues, being able to put more than one tabular form on a page can be a great enrichment for your application. You can check a working example on my demo application

Good luck!

Tuesday, 30 July 2013

Detail section in line with report, part 2

In my previous post I explained how you can display a details section within an (interactive) report. The solution relied on using an iframe to display a detail report or –form on another page and on jQuery to display or hide the details. This solution works great in some cases, but it has a few shortcomings. In this post I will discuss two of the most apparent problems.
The first big problem arises when we use session state protection. Session state protection prevents unauthorized manipulation of the URLs within your application. The session state protection creates a checksum that is appended after each page URL, without a valid checksum you can’t navigate through your application. In our setup thus far we could simply create the URL for the iframe that holds the report details. With session state protection enabled, we need to find a solution to create a valid checksum that we can use in our URL.
The apex_util package has a function, prepare_url, that takes your URL as parameter and returns you the same URL extended with a checksum. This requires us to use pl/sql, and our URL is created in a jQuery dynamic action. What we’re going to do is remove the URL from the dynamic action and instead add it as a column to the report query, using the prepare_url function.
Since we don’t need to display the URL in our, but we do need to be able to find it with JQuery, we give the report heading a simple span as title and de “Display as” attribute we set to “Standard Report Column”. In the column link section we set the “Target” attribute to “URL” and the “URL” attribute to “#DET_LINK#” – this is a substitution of the column name we gave the prepare_url column in our report query.
Now that we have our URL ready, we need to modify our dynamic action. The URL to the details section of each row can be reached with But note that the iframe needs the url domain prepended whereas the prepare_url function doesn’t . Also, now that we have the URL ready, we don’t need the variables for application id and session id, so we remove them from the dynamic action. The code no looks as follows:
With these changes we have a working report and iframe again, this time with session state protection.

The second issue I’d like to discuss is partial page refresh. Partial page refresh reloads a region of your page, without submitting or reloading the entire page. This is really handy, says when You use a modal page to update or modify the details of our your report and you want to immediate show those changes. Unfortunattely, the refresh of the region unbinds our jQuery function that opens and closes the details, so we can no longer show details until we reload the entire page. To better show this issue I’ve changed the detail report in the example application to a tabular form that lets you make some changes to the emp table.
To better display the and control the tabular form, we add a hidden item ‘READONLY’ that we will set to ‘Y’ from our report url link, so that when we open the form as an iframe the item will be ‘Y’. We add a page load dynamic action on the tabular form page that will hide and DISABLE! The page buttons and will disable the form fields.
Also we add a modal page to edit the EMP table. For this we can use the Modal Page plugin from Skillbuilders, that’s an easy and flexible plugin that lets you make a modal page in just a few clicks.
Now it is important to remember that we had session state protection enabled, so the modal page attribute “Static URL” must get an URL with a checksum. To do this, we can a hidden item, here TEMP_URL and set it’s source with a pl/sql expression. As expression we again use the apex_util.prepare_url function. We create a buttton to fire the dynamic action.
At this point we have a page with a modal page that we can use to update the EMP table and an iframe that we can use to display the employees per department. To immediately show the changes we make in the modal page, we add a refresh action on report region. We let the refresh take place after we click on the close button of the modal page.
Because the refresh of the report unbinds the dynamic action that controls the display of the report details, we need to find a way to rebind the dynamic action. At this point it might be a wise dissision to avoid a growing number of dynamic actions, and move our jQuery function to a seperate js file. In a file it is also rather easy to control the rebinding of the function after the report region refreshed.
In our js file we have two functions. One is the click function we already have, the other is a function that adds a class to each row in the dept report. That function needs to be rebinded after the region refresh. The code in our file looks like this:
We add the file to our page by uploading it in shared components > static files. In our page we can add the file in the page settings under the JavaScript section. We can reference the file library with the #APP_IMAGES# substitution.
At this point we have all we need. The dynamic action that controlled the display of the details section is now covered by the JavaScript file, so we can delete the dynamic action. By now our report is working as we expect it to and it can handle session state protection and partial page refresh.
to see a working demo watch my demo application.
Enjoy.