Thursday 29 August 2013

Filter column groups in a report

Recently I read a couple of questions regarding the display of reports with a large number of columns. Basically it is not considered good practice to flood your page with loads of information, same goes for a report: the more columns your report has, the harder it becomes to interpret. That being said, many applications are data intensive and breaking up all information in manageable portions can be challenging.

When it comes to a report, there are a number ways to streamline the data output. One such way is by displaying a number of columns in an inline view, I discussed that option in a previous blog post. Another way to limit the number of columns in your report considers grouping of columns and conditionally show and hide them. In this post I will explain how this works by example of the EMP and DEPT table.

To start off we’ll create a report on both the EMP and the DEPT table. I’ve used an interactive report, but you can use a classic report if you like. A tabular form might work as well, but make sure that you don’t hide columns that are not nullable. The query is straight forward:

We want to group our report columns in a group EMP, a group DEPT, and to show the relation between the tables, we also want to show ALL columns. Now we need something to select one of these groups. We could use a page button that sets a page item, but we don’t really want to submit our page every time we want to change the report display, besides buttons are more associated with submitting data, a select list might do the trick, but a set of tabs looks better. So let’s create a bit of html that generates a set of tabs:

Note that I’ve used apex-rds* classes throughout the filter list. These classes are derived from the apex “region display selector”; this has the big advantage that we can adopt the css that goes with the region display selector, so our filter buttons will blend in nicely in our page. The html is stored in a separate html region. Make the html region a parent of the report region to ensure the filter tabs are visually associated with the report.
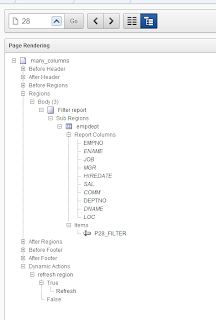
parentRegion

We hand each html list item an ID, these will be stored in a hidden page item that will be set by a jQuery function. The jQuery goes in the page attributes under JavaScript functions and global variable declaration and should look something like this:

The “selected”-class is a visual aid that will distinguish the selected filter from the others. On page load we all select the first filter. The ID of the selected filter is stored in a page item (‘P28_FILTER’).

We’ll use the page item value as display condition for the report columns, we want all columns to show when we select “SHOW_ALL”, only the EMP columns when we select “SHOW_EMP” and only the DEPT columns when we select “SHOW_DEPT”. We can use a display condition “Value Item / Column in Expression 1 is Contained within Colon Delimited List in Expression 2”
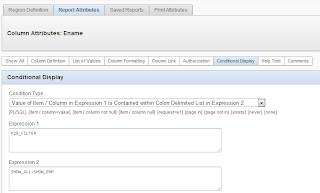
displayConditionExample

Set these conditions on all EMP columns, and do the same for the DEPT columns only replace the ‘SHOW_EMP’ with ‘SHOW_DEPT’. In my example I chose to always display the empno and deptno columns, so I didn't hand them a display condition.

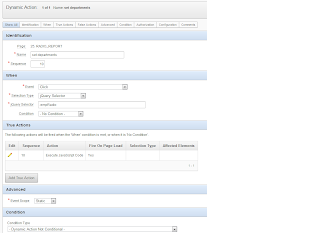
With the display conditions set, our page is almost ready, all we need is to refresh the report after we click a filter so the filter takes effect. For this we create a dynamic action that fires on click of jQuery selector ‘.apex-rds-li’, which is a class that all filter tabs have been handed. The dynamic action will do a refresh of the report region. Last, make sure that we add the page item in the ‘Page Items to submit’ section of the report
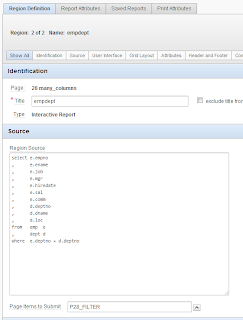
pageItemsToSubmit

Now we have all in place and we should have a working report with filter buttons that conditionally display groups of columns. You can view a working example in my demo application.

Enjoy!
Saturday 24 August 2013

Using radio buttons in an APEX report

In my previous post I used the apex_item package to create a report with html input fields and checkboxes. In this blog I want to show a way to implement radio buttons in your report.

Radio buttons are very useful when you want to hand your users a limited number of options and you want to ensure that only one option can be selected. From a user point of view, a radio button is very intuitive. To implement them in an APEX report however, is a little less intuitive. To explain the implementation we will create a report on the “EMP” table where we use radio buttons to assign employees to a department.

To get started we’ll create a report on the “EMP” table, but instead of the “DEPTNO” column we will select a set of radio buttons, one for each department number. The query looks as follows:

Note that we use rownum as index parameter. This ensures that all radio buttons on the same table row, have the same index, so only one radio button per table row can be selected. This provides a challenge later on, because we have to assess each row to determine what button is selected. This is a bit different than, for example the checkboxes in the first column of a tabular form, because they are assessed on column level, so you can refer to the f_array of that column to get each selected value.

Since we can’t use an f_array to determine department numbers, we will use jQuery to loop over the table rows and see which department is selected. To do that we need to hand each radio button an html class, this is handed in the “attributes” parameter.

In this query a display name is also handed, that can also be discarded since that name will also appear as column header, in practice you can use either one, which ever suits you best.

Also we hand our report a static id. Here it’s called “radioReport” and last we’ll create a hidden item for each department that’s in our query.

Now that the report is set up, we’ll create the jQuery function that loops over the report and check the radio buttons. In the end we want to update the "EMP" table, and assign department numbers to employees, so we’ll create a function that looks at each table row, sees what department is selected and store the employee number of that table row in the appropriate page item. For example:

This function will be handled by a dynamic action. The dynamic action must be triggered by a click on either radio button, so we use the radio button class that we added in the query as the trigger of the function.

dynamic action triggered by radio button jQuery function mapping employees to departments

Now that we have our report and we can check which employee belongs that each department, we have to write an update procedure. For simplicity we’ll use a page process that is triggered on submit of the page, for this we need a submit button and a page submit process. The update on the “EMP” table can be done in a number of ways; here we’ll use the “STRING_TO_TABLE” function to map each employee number of a page item into an associative array, the “APEX_APPLICATION_GLOBAL.VC_ARR2”. For the update we loop over each array and update the department for each employee.

And now we have a working report with radio buttons. You can check a working demo on my demo application. Of course don’t forget to check the Oracle docs for more info on apex_items, or string_to_table.

Good luck!

Sunday 11 August 2013

Two tabular forms, one page

Tabular forms are very effective when it comes to mutating (table) data. Unfortunately APEX allows you to use only one tabular form per page. Lucky for us, there are ways to get more than one tab form on a page. In my demo application I have one example of two iFrames in one page; each iFrame contains a tabular form page. This is about the simplest way to get two tab forms on a page. Sadly this way you will have a set of buttons for each page. A more advanced way is to create the tabular forms yourself, instead of using the APEX generated tab form. There are a number of examples on how to do that, see amongst others Denes Kubicicek and Martin D'Souza.

In this post I would like to add to the stack, an example of how you can easily create tabular forms yourself. In the example I will use the apex_item package to create input fields for each report column. On top I'll use jQuery to add rows and in preparation of the delete process. The use jQuery for adding rows to the form shows a bit more of what apex is doing in the background when you generate an apex_item field. And, best of all, one tabular form is going to be an interactive report, with sorting and filtering options.

To start we create an interactive report on the EMP table, but instead of doing a normal "select * from EMP", we need to call each column with apex_item functions. The query will look as follows: apex_item_emp_query The number in the apex_item that precedes the column name, refers to the f_array the column will be mapped to. Make sure that each column is set to 'Standard Report Column' in the report attributes section. We also add a static ID to the report, this is needed later on when we create the add row function. Our report on EMP is now ready.

Next, we create the DEPT report. This is done the same way we created the EMP report, only now we choose a standard report (APEX allows you to create no more than one interactive report per page). Again, make sure each column is set as 'Standard Report Column' and provide a static ID to distinguish your report. The query will look like this: Note that we already used f_01 to f_09 for our EMP report, so we have to choose another range of numbers for the apex_items of our DEPT report. Here I used 11 to 14.

Now that we have two reports with input fields, we need to create a procedure to handle the inserts and updates on the EMP and DEPT tables. You could do this in one process, but here I made one insert/update process for EMP, and one for DEPT. That way it's easier to see what's going on. First we create a submit button. Then we create a page process that fires on submit, after computations and validations. In the process we need to loop over the f_array and map each f_item with the correct table column, so f_02 is EMPNO, f_03 is ENAME, etc. page_process_EMP_DML The process for DEPT table is basically the same, the code will be: Note that I've put list tags around the success message. We will use one submit button that triggers both processes, with list tags both success messages will show better. Make sure that you add a button condition to the processes so we only do an update or insert when the button 'submit' is pressed.

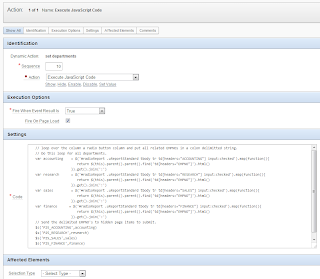
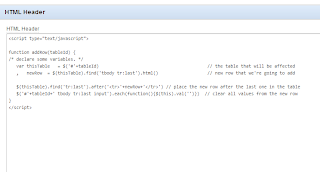
At this point we can do updates on both tab forms. The process for inserting records is there as well, so now is a good time to create our 'add row' function. The function will basically copy the last row of a table, empty all data and paste the row at the end of the table. Since this is a generic function that can be used on more than one page in your application, you should put the function in a JavaScript file that you include in your application. Here I simply put the function in the page header. page_header_js The function expects a table ID as input. We gave our reports static ID's, but unfortunately APEX tables are wrapped in a number of div's and tables, so we need to add an ID to the exact table as well. This is done by a page load dynamic action. da_act_ID The dynamic action adds an ID to the table within a table within the table that we gave our static ID. With ID's added to the correct tables we can now create the dynamic actions that call the addRow function. To call the function we need two 'add row' buttons, one for each report. For simplicity I've created a dynamic action for each add row button, this could of course be done with one function as well, but then you need to determine which button called the function and thus to which table a row needs to be added. The dynamic actions will fire on click of the add row button and it will call the addRow function with the appropriate table ID. da_add_row da_act_add_row By now we can add rows to each report, so we can update and insert records.

The last thing we need to do is make create a delete process. We want to delete all rows we've checked with the report checkboxes. The checkboxes of the EMP table and the DEPT table all hold the primary key values of each table row, so it makes sense to use that. We'll create a dynamic action that looks for checked checkboxes and store their corresponding values in a hidden page item. The dynamic action is fired when a checkbox of either table is clicked. da_PKda_act_pk 'P17_EMPNOS' and 'P17_DEPTNOS' here are our hidden items. We store our primary key values in these items as colon delimited strings. The delete process is plain simple, now that we have our primary key values. We use apex_util.string_to_table to create a vc_array of pk values and use that for a delete: delete_process Now we only need to create a delete button and make sure the delete process only fires when the delete button is pressed.

That was the last step in the way. We now have one page with tow tabular forms. One tabular form is an interactive report. Each report has its own 'add row' button, page the page submit buttons control both tables. As I wrote at the beginning a used jQuery to add a row to a table because it helps to show what APEX is doing when you create apex_items: it simply generates the html for an input field. The f_xx number is used as name attribute for each input field. Note that this ‘add row’ function works well, but since it copies the html of the previous row, it only works if your report has at least one row to begin with. If you create a report on an empty table, there would be no table row to copy the html from. For the interactive report it serves to tell that all input fields are rendered as strings, even the numeric fields. Therefore aggregations on columns -e.g. the sum of salaries per department- won't work. Despite these issues, being able to put more than one tabular form on a page can be a great enrichment for your application. You can check a working example on my demo application

Good luck!